The FoodVillage food & beverage ordering platform collects very useful and detailed restaurant data analytics that will help you understand your customers and the success of a sales campaign that you may be running.

1. Viewing Sales Data By Date Ranges
One very useful feature you will find is the ability to view your sales data analytics by date ranges. You can view them by year, month, week and day. The data is then displayed by revenue or number of sales and broken down into granular time segments. This data will help you understand your sales trend and customer shopping behaviour.
Along with that, you will also be able to view the following data based on the date range you select:
- Total sales revenue
- Total number of orders
- Total value and number of tips (if you turn on this option)
2. Payment Methods
Depending on the number of payment methods you use, you will see the breakdown of each payment method in total value and frequency of use. The payment gateways that you can use with our system include Paypal, Stripe, iPay88 and GKash.
3. Order Types
There are three order types (Pickups, Deliveries and Dine-Ins) that would be displayed with the corresponding value and number of sales.
The order types will help you understand what services are popular with your customers or the services that you should promote.
4. Order Status

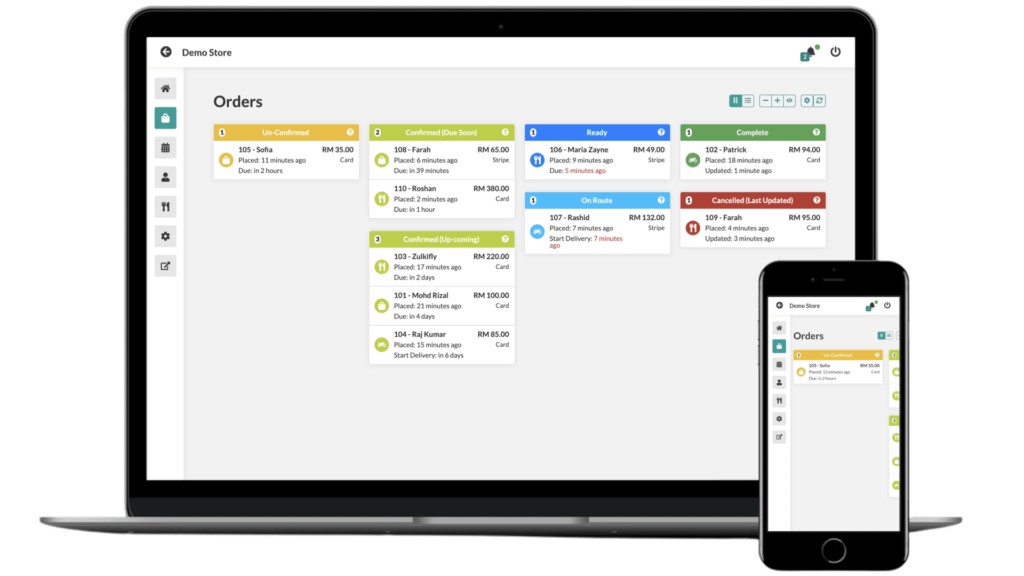
Store managers will love how easy it is to view the status of all orders at a glance from the order dashboard. FoodVillage automatically updates the status of each order in an organised fashion. From unconfirmed, to confirmed or confirmed (up-coming), to ready, to on route (for deliveries) and finally completed orders. There is also a section for cancelled orders.
A store manager or the owner can access this is the order fulfilment control centre and receive an immediate reflection of how well your team is able to process and fulfil orders.
5. Item & Category Counts
Item Counts display the total number of orders made for a particular dish. This information helps you to understand what are the top-selling products that you are offering.
Category Counts as the name suggests present the top-performing categories. Example: you may have many types of noodles but one category for noodles. So even though you may have top selling products that are not noodles, but collectively as a category, noodles may be the top-performing category.
6. Taxes
If you have activated the sales tax feature on our platform, you will be able to view the following data in this section:
- Tax name and rate
- Total taxes
- Total taxable revenue
- A total list of every single sales order, total order and total tax arranged in descending order by date
7. Downloadable Data
You can download Every order item in CSV format with the ability to customise what data you wish in each download. Your staff can download a total of 32 data points per order. Here are some not already mentioned above:
- Number of items
- Promo codes
- Phone
- Delivery Address
- Delivery distance
- Pick up time
When it comes to e-commerce, sales data analytics is key to success. You need to know who your customers are, what they’re buying, when they are buying, and more in order to make decisions about pricing, inventory, marketing, and beyond. Thankfully, you can easily analyze your web store’s data with the sales data already provided on our platform.
If this isn’t sufficient for you, you will be glad to know that our system can include Google Analytics and Facebook Pixel. Contact us to find out more or to register an account today.


